Introduction
With the introduction of Galera replication for MySQL, Codership has, in my opinion, provide the most significant support to MySQL that the community had seen in the last tree years.
Codership had filled a significant gap in MySQL replication capability, succeeding in a task where many before had failed.
Not only Codership is constantly committed in doing their solution better and more solid, and they are the most friendly and helpful team I have met in years.
In short chapeau to all of the guys! Great job, I am really proud to have the opportunity to discuss, interact with you.
Said that, no product or code around is unmingled of errors and/or issues at different level. So also if Galera help us a lot solving many replication and architectural issues it still has some limitation that must be taken in consideration.
Galera is easy to setup, especially to perform a basic setup, which will work fine for almost all basic OLTP low level and local traffic.
Unfortunately I have seen many implementations that had start as basic and then become something different, in usage and very often in design.
The most common mistake, from architectural point of view, I have seen is when customers starts with a simple cluster of 3 nodes all based on local network, and then given it "works so great" they decide to add one/two nodes on a geographic distributed site.
This solution is not wrong "per se" but it is how it is implemented that makes the difference.
The easiest way to explain what I mean and what should not be done, it is to use a real case, and describe what was implemented and how we had evolve the solution, while Codership was optimizing their product.
{autotoc enabled=yes}
Customer scenario
The customer approaches us after few months from an activity that was focus on showing them the basics of how MySQL/Galera works.
They reach us as an emergency given their cluster was totally stuck and their production site was down.
In order to understand what happened we need first take a look to what the customer put up.
Customer environment description
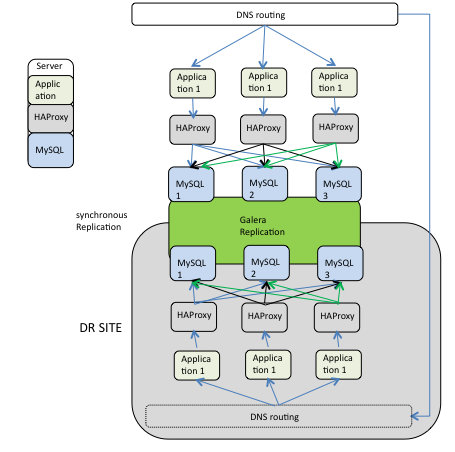
The initial environment of one single application node pointing to a cluster of 3 MySQL/Galera nodes, was transformed into a 6 (or more) application nodes getting traffic from a balancer, each application nodes could write in any Data node (round robin) residing in the same geographic area (at least), but cluster was geographically distributed 3 nodes in site A, 3 nodes in site B.
As result the customer navigation was jumping from one application server to another, and from one Data node to another as well.
Transactions were small and relevant only for a single request.
Finally each application node had a timer to clean up "old" session, the concept of OLD was relevant only to the local node and it could happen that an OLD session was in fact still on going on another application node.
In short, the customer was pushing randomly traffic to both zones, using a single table for the sessions to coordinate the activities, but also purging them without any good locking mechanism:
Problem description
When I connect to the machine, I was not aware of the architecture as it was; I was still referring to what I had found in our history, so one Application node and a simple cluster.
Takes me 5 seconds, to see that the situation was quite different. The cluster was suffering from many point of view, Flow Control was high very often, and nodes between the zones were declare dead often.
Takes me some time to let the customer understand why that was not working correctly, and why the architecture was design wrongly. Mostly because they were claiming that it was working fine before (reminds me "on my machine works" doesn't it?). Discussion on what before was, how much traffic/load and so on.
Finally, they redirect all the traffic to one zone only and at least the FC went down enough to have the site to work, and to give me the chance to review the settings and try to optimize it.
To keep it up I had to increase the FC related variable, to modify galera parameters for nodes time out, and obviously optimize MySQL itself, and we survive a bit.
For the scope of the article focus on the geographic replication, I am not to report all the review, but the part related to the subject.
As said I had extended time outs and FC, but I was not happy and as such I had tested in more details what the network was really allowing to transmit.
[root@xx ~]# netperf -H 10.0.0.12 -t TCP_RR -v 2  -- -b 6 -r 32K -S 256K -S 256K
MIGRATED TCP REQUEST/RESPONSE TEST from 0.0.0.0 (0.0.0.0) port 0 AF_INET to 10.0.0.12 () port 0 AF_INET : first burst 6
Local /Remote
Socket Size   Request  Resp.   Elapsed  Trans.
Send   Recv   Size     Size    Time     Rate
bytes  Bytes  bytes    bytes   secs.    per sec

16384  87380  32768    32768   10.01      97.45
249856 249856
Alignment      Offset         RoundTrip  Trans    Throughput
Local  Remote  Local  Remote  Latency    Rate     10^6bits/s
Send   Recv    Send   Recv    usec/Tran  per sec  Outbound   Inbound
    8      0       0      0   71830.852   97.451 25.546    25.546  <------------ 71ms
So a simple round trip for a small record of 32K takes 71 ms, what if I simulate a basic load of 1Mb?
[root@xx ~]# netperf -H 10.2.3.30  -t TCP_RR -v 2  -- -b 6 -r 1M,32K -S 256K -S 256K
MIGRATED TCP REQUEST/RESPONSE TEST from 0.0.0.0 (0.0.0.0) port 0 AF_INET to 10.2.3.30 () port 0 AF_INET : first burst 6
Local /Remote
Socket Size   Request  Resp.   Elapsed  Trans.
Send   Recv   Size     Size    Time     Rate
bytes  Bytes  bytes    bytes   secs.    per sec

16384  87380  1048576   32768   10.00       2.70
249856 249856
Alignment      Offset         RoundTrip  Trans    Throughput
Local  Remote  Local  Remote  Latency    Rate     10^6bits/s
Send   Recv    Send   Recv    usec/Tran  per sec  Outbound   Inbound
    8      0       0      0   2592709.047   2.700  22.648    0.708  <-- we have 2592.709047 ms latency
Note, to understand better what was going on and why I use this method to evaluate the network read my other article (Effective way to check the network connection performance, when using replication geographically distributed)
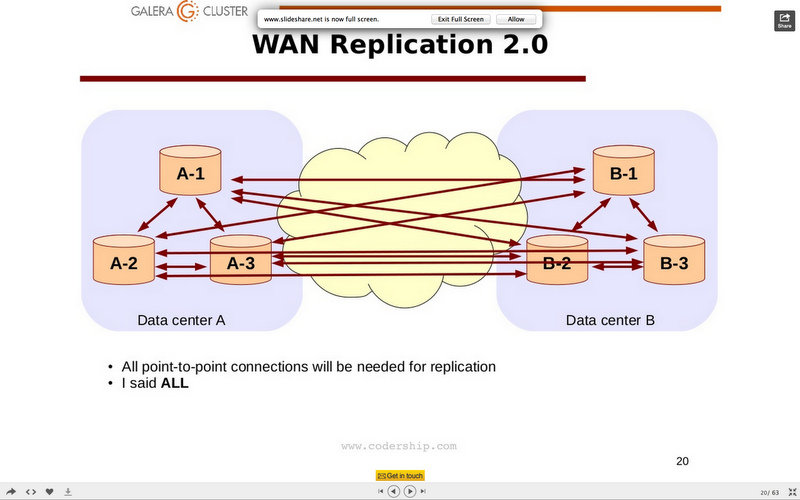
What we had to do
With this kind of connectivity, it is very unluckily that we can have the galera replication working correctly. Not even if we keep only one site as master and the other as stand by. The way the nodes communicate and validate the writesets will be too demanding.
See the below diagram from Codership to understand why
The only alternative to this is to use asynchronous connection and set two nodes, one for each site in master-master mode:
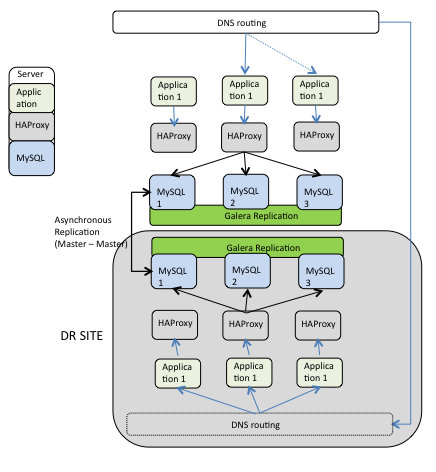
Setup a master-master, means that we loose the automatic replication shift from one node to another. That is it, this solution while fix the latency problem because use asynchronous replication, it does imply that in case of crash of one of the two nodes connected, you must manually move the replication to another node.
How to set it up how to fix when it breaks
Setting up asynchronous replication in a galera cluster is quite easy.
Assuming you have two nodes connected as master master (A1 B1) and assuming the only active was A1 and that it crashes, the only thing you need to do is to check on B1 for:
+----------------------+-----------+
| Variable_name        | Value     |
+----------------------+-----------+
| wsrep_last_committed | 221463896 |
+----------------------+-----------+
In the status variables, then look on the node you had choose as master say A2, for the binary log containing the
Xid = 221463896
And issue the command CHANGE MASTER with the coordinates you will find there.
Then on A2 set the node as slave of the B1 using the Master coordinates from that node.
The procedure is simple and obviously worked decently, given the situation.
Customer was obviously not happy because they would like to have the two cluster in perfectly sync, but that was at least good enough to keep the site working efficiently. Not only after we set it up, we had at least two incidents to production, and we had successfully able to fail over to DR and then Failback with less then few seconds of service interruption.
Anyhow our friends in Codership had already release the new version of Galera (3.x), working on MySQL 5.6.
So while the customer was refining and correcting a lot of issues their side, mainly in the code and how the application was using the common table.
I had review, test and crashed MySQL 5.6/Galera3.
Galera 3.0 comes with some interesting new enhancement, see for an overview http://www.slideshare.net/Severalnines/webinar-slides-27249453.
At the moment of writing Seppo is close to deliver the speech about the new features in Galera 4 at Percona Live London 2014. (http://www.percona.com/live/london-2014/sessions/galera-cluster-new-features)
Galera 3.X group replication and how this can change everything.
In Galera 3, the introduction of the segment concept basically isolate/identify a group of data nodes inside a cluster.
The meaning is that any node with the same segment value will communicate extensively to each other, while intra-segments they elect one node for each segment as communication channel:
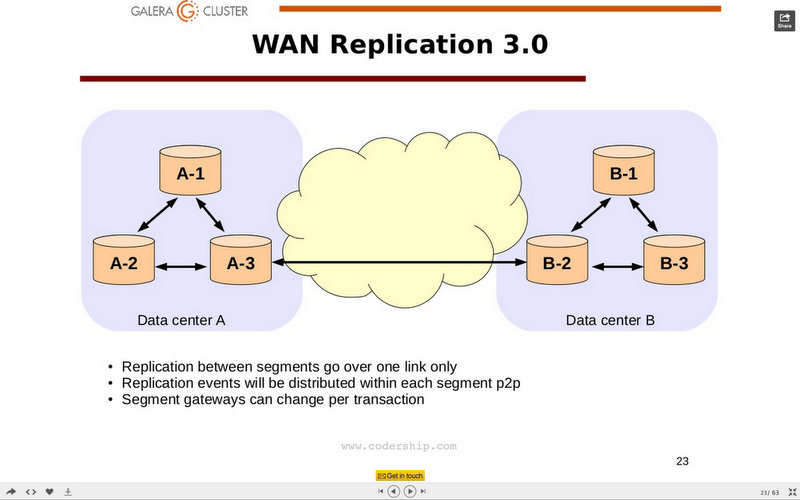
Quorum calculation is also taken in to account the segments allocation.
In the presentation I have linked here there is mention that using segments will allow managing WAN latency of 100-300 ms.
Given I am a skeptical, I decide to perform extensive tests, and see/identify what it is really possible to accomplish.
Investigations
I did several tests, involving many parameters in galera, but at the end I had two main actors I was playing with, the max_packet size and gcache pagesize.
All the others ones changed had prove to be stable and efficient, below the settings I had used.
How to test the problem
I have setup 8 different tests:
1) simple insert on 1 node from 3 apps
2) simple insert on 1 node for segment on DR only one app on production 2
3) simple insert on 1 node from 3 apps GALERA PACK larger
4) simple insert on 1 node for on DR only one app on production 2 GALERA PACK larger
5) simple insert on 1 node from 3 apps BUT with WAN connection
6) simple insert on 1 node for on DR only one app on production 2 BUT with WAN connection
7) simple insert on 1 node from 3 apps BUT with WAN connection AND GALERA PACK larger
8) simple insert on 1 node on DR only one app on production 2 BUT with WAN connection AND GALERA PACK larger
Each test was using OLTP approach, with 5 main tables and 6 child tables with the following structure:
tbtest1 | CREATE TABLE `tbtest1` (
  `autoInc` bigint(11) NOT NULL AUTO_INCREMENT,
  `a` int(11) NOT NULL,
  `uuid` char(36) COLLATE utf8_bin NOT NULL,
  `b` varchar(100) COLLATE utf8_bin NOT NULL,
  `c` char(200) COLLATE utf8_bin NOT NULL,
  `counter` bigint(20) DEFAULT NULL,
  `time` timestamp NOT NULL DEFAULT CURRENT_TIMESTAMP ON UPDATE CURRENT_TIMESTAMP,
  `partitionid` int(11) NOT NULL DEFAULT '0',
  `date` date NOT NULL,
  `strrecordtype` char(3) COLLATE utf8_bin DEFAULT NULL,
  PRIMARY KEY (`autoInc`,`partitionid`),
  KEY `IDX_a` (`a`),
  KEY `IDX_uuid` (`uuid`)
) ENGINE=InnoDB AUTO_INCREMENT=3474631 DEFAULT CHARSET=utf8 COLLATE=utf8_bin |

CREATE TABLE: CREATE TABLE `tbtest_child1` (
  `a` int(11) NOT NULL,
  `bb` int(11) NOT NULL AUTO_INCREMENT,
  `date` date NOT NULL,
  `partitionid` int(11) NOT NULL DEFAULT '0',
  `stroperation` varchar(254) COLLATE utf8_bin DEFAULT NULL,
  `time` timestamp NOT NULL DEFAULT CURRENT_TIMESTAMP ON UPDATE CURRENT_TIMESTAMP,
  PRIMARY KEY (`a`,`bb`),
  UNIQUE KEY `bb` (`bb`)
) ENGINE=InnoDB AUTO_INCREMENT=36289 DEFAULT CHARSET=utf8 COLLATE=utf8_bin
1 row IN SET (0.00 sec)
Using 3 application nodes, each was having 8 children treads for a total of 24 threads writing on the cluster.
The tests performed from 1 to 4 where done as baseline so NO WAN network simulation.
When I mention Galera pack larger I refer specifically to:
gcs.max_packet_size
This value is "All writesets exceeding that size will be fragmented." And it is set by default to 32Kb, which means anything larger that will be fragmented in side galera. My understanding is that writeset package exceeding that dimension will be split in smaller packages. But given the dimension of 32K, or even less is significantly larger then the network frame dimension, the packet fragmentation will take place in any case, but at lower level (network).
My reasoning here was, why I should want to do that, if I already have frame fragmentation at network (TCP/IP) level? I may get the meaning of the parameter wrong, but if not is worth a try.
On this regards I had also optimize the machine network layer:
net.core.optmem_max = 40960
net.core.rmem_max = 16777216
net.core.wmem_max = 16777216
net.core.rmem_default = 16777216
net.core.wmem_default = 16777216
net.ipv4.tcp_rmem = 4096 87380 16777216
net.ipv4.tcp_wmem = 4096 65536 16777216
net.core.netdev_max_backlog = 50000
net.ipv4.tcp_max_syn_backlog = 30000
net.ipv4.tcp_congestion_control=htcp
net.ipv4.tcp_mtu_probing=1
net.ipv4.tcp_max_tw_buckets = 2000000
net.ipv4.tcp_tw_reuse = 1
net.ipv4.tcp_fin_timeout = 30
net.ipv4.tcp_slow_start_after_idle = 0
I run the tests on 6 data nodes using 2 segments, in virtualized environment, 8 core 8GB raid 10 6 10k RPM disks, CentOS 6.
On purpose I had skip HAProxy and prefer to pint directly on the node I had defined.
The applications were closing and opening connection at each transaction to emulate the customer behavior.
When simulating the wan network I had set a final total latency of :
root@galera1h1n5 galera56N1]# netperf -H 10.0.0.33 -t TCP_RR -v 2  -- -b 6 -r 120K,64K -S 156K -S 156K
MIGRATED TCP REQUEST/RESPONSE TEST from 0.0.0.0 (0.0.0.0) port 0 AF_INET to 10.0.0.33 () port 0 AF_INET : first burst 6
Local /Remote
Socket Size   Request  Resp.   Elapsed  Trans.
Send   Recv   Size     Size    Time     Rate
bytes  Bytes  bytes    bytes   secs.    per sec

65536  87380  122880   65536   10.00       1.90
319488 319488
Alignment      Offset         RoundTrip  Trans    Throughput
Local  Remote  Local  Remote  Latency    Rate     10^6bits/s
Send   Recv    Send   Recv    usec/Tran  per sec  Outbound   Inbound
    8      0       0      0   3684481.420   1.900  1.868     0.996  <----- 3684.481 ms
With packet reordering 15-20%.
Just for the good of comparison a PING whould had report:
[root@galera1h1n5 galera56N1]# ping -M  do -s 1472 -c 3 10.0.0.33
PING 10.0.0.33 (10.0.0.33) 1472(1500) bytes of data.
1480 bytes from 10.0.0.33: icmp_seq=1 ttl=64 time=403 ms
1480 bytes from 10.0.0.33: icmp_seq=2 ttl=64 time=389 ms
1480 bytes from 10.0.0.33: icmp_seq=3 ttl=64 time=410 ms
So ~400 ms for 1427 (1500) bytes.
With all this in place, I have started to roll the ball and collected my data.
To notice that I have run each set of test at least 5 times, to validate the data collected, and data was clean, refresh and InnoDB BP reload at any test.
Before reaching the last set of tests (the final 2 sets) I had run a total amount of 64 variants of the tests, sometime crashing galera, sometime getting so bad performance that it was obvious that would not be usable in production, and so on.
Anyhow, I was more focus on the replication performance/behavior than on what MySQL/Innodb was doing given I was not looking for an ultra-fine tuning at that level, actually some imperfections had fit my purpose better.
Related issues
Initially I was not using an optimize network settings, and as soon as I reach the first time the tests 7-8 I had issues, in short the test 7 was taking 4 time longer then test 5 (his twin), and in some cases it was so bad that I had to stop it.
But once the network was set up correctly most of the issue disappears.
Results
Who wins?
There is not a single winner; all the tests shows that there is the need to carefully pick the right solution for the job.
But these two sets of tests, and settings had proven to be stable and better performing then all the others in my simulation:
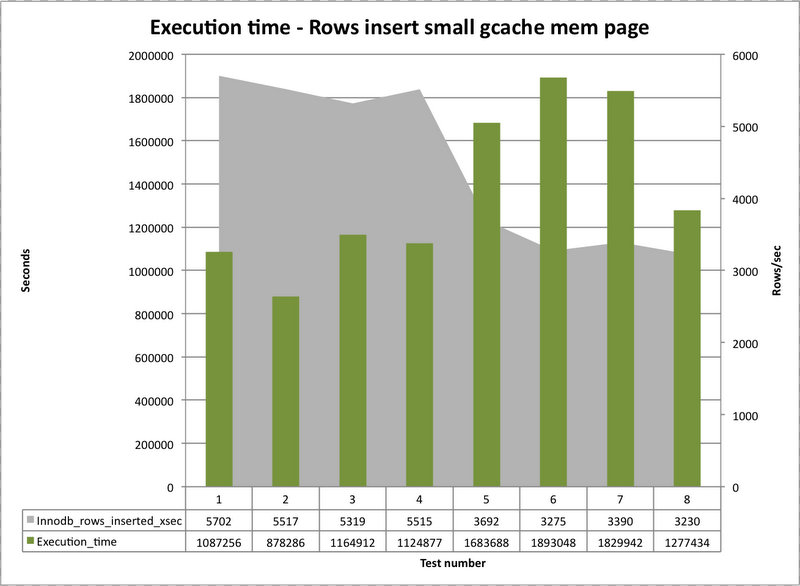
This first image show the set of tests perform with the gcahe page set to a lower value of 32Mb and more instances 4.
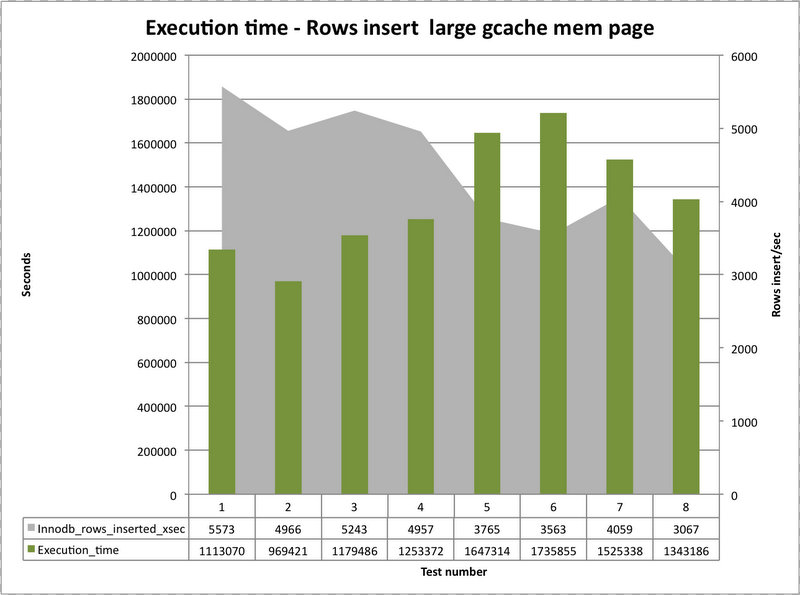
This second one shows the test with a larger page of 250Mb and only 2 instances.
I did not include the starting test where the page/instance was set by defaults, because it was providing less performance.
Comparing the two, we can see that there is a different behavior between the tests done on a local network and the ones using the WAN.
In the case of a LAN where the cluster is less limited in the performance at network level, the use of more smaller gcache pages with more instances, had allow the cluster and MySQL to insert ~5700-5300 row/sec.
The use of a large gcache page and only 2 instances, on the other side see the drop of the performance to ~5500-4950 row/sec.
The difference is not significant with this traffic, but is interesting t note that it exists and is consistent on all the tests.
My side, this means we have something that add a cost, significant cost when galera need to access a less number of gcache page. Given this is a memory access I am oriented to think there is a mutex that prevent the usage of the single page/resource.
On the other hand the Large gcache page, seems providing better support in the case of a distribute cluster.
I assume that given the transmission is slowed down by the network, galera/MySQL is able to better utilize the less instances of the gcache memory pages.
Never the less, the large gcache with less instances, had be less effective when inserting in multiple nodes then the small gcache page with more instances and larger gcs.max_packet_size.
But that is not all.
When using larger packet size (gcs.max_packet_size), I was consistently able to complete the tests in less time when I was using a geographically distributed cluster, large gcache page and multiple nodes writing.
While when the cluster was performing locally, the small (standard) gcs.max_packet_size was working better.
Let us navigate the results.
Segments distribution
The first test I have done is to be sure that the segments where working as expected.
The cluster was compose by 2 segments, each segment 3 nodes.
Segment 1 nodes IP ending with: 5,21,23
Segment 2 nodes IP ending with 2,23,33
Local cluster(same network)
Display paused 19.1Mb           38.1Mb   57.2Mb           76.3Mb     95.4Mb
└───────────────┴────────────────┴────────┴────────────────┴────────────────
10.0.0.5                <=> 10.0.0.21        1.65GB  76.8Kb  63.9Kb  67.1Kb
10.0.0.5                <=> 10.0.0.31        1.63GB  63.8Kb  51.8Kb  55.2Kb
10.0.0.5                <=> 10.0.0.23        1.58GB  31.8Kb  26.2Kb  28.5Kb <----
10.0.0.5                <=> 10.0.0.2         30.8MB  19.3Kb  15.4Kb  16.2Kb
10.0.0.5                <=> 10.0.0.33         270KB   848b   1.81Kb  1.74Kb


 Display paused  19.1Mb           38.1Mb   57.2Mb           76.3Mb     95.4Mb
└────────────────┴────────────────┴────────┴────────────────┴────────────────
10.0.0.21               <=> 10.0.0.5          1.70GB  70.7Kb  71.6Kb  67.5Kb
10.0.0.21               <=> 10.0.0.31         83.4MB  44.9Kb  43.3Kb  40.9Kb
10.0.0.21               <=> 10.0.0.2          31.8MB  15.6Kb  16.9Kb  16.5Kb <---- ??
10.0.0.21               <=> 10.0.0.33         32.1MB  15.6Kb  16.8Kb  16.3Kb <---- ??
10.0.0.21               <=> 10.0.0.23          269KB   848b   1.34Kb  1.36Kb


Display paused  19.1Mb           38.1Mb   57.2Mb           76.3Mb     95.4Mb
└────────────────┴────────────────┴────────┴────────────────┴────────────────
10.0.0.31               <=> 10.0.0.5          1.67GB  56.5Kb  58.3Kb  55.7Kb
10.0.0.31               <=> 10.0.0.21         83.4MB  44.7Kb  43.3Kb  41.5Kb
10.0.0.31               <=> 10.0.0.2          31.7MB  19.6Kb  17.6Kb  17.2Kb <---- ??
10.0.0.31               <=> 10.0.0.33          273KB   848b   1.98Kb  1.89Kb
10.0.0.31               <=> 10.0.0.23          269KB   848b   1.85Kb  1.72Kb

 Display paused 19.1Mb           38.1Mb   57.2Mb           76.3Mb     95.4Mb
└───────────────┴───────────────┴─────────┴──────────────┴────────────────
10.0.0.2              <=> 10.0.0.23       1.70GB  71.2Kb  71.2Kb  67.6Kb
10.0.0.2              <=> 10.0.0.33        111MB  58.2Kb  57.6Kb  54.6Kb
10.0.0.2              <=> 10.0.0.31       31.7MB  20.2Kb  17.7Kb  16.9Kb <---- ??
10.0.0.2              <=> 10.0.0.5        30.8MB  15.6Kb  17.3Kb  16.5Kb <---- ??
10.0.0.2              <=> 10.0.0.21       31.8MB  15.6Kb  16.9Kb  16.5Kb <---- ??

 Display paused 19.1Mb           38.1Mb   57.2Mb           76.3Mb     95.4Mb
───────────────┴───────────────┴────────────────────────┴────────────────
10.0.0.23              <=> 10.0.0.2        1.65GB  71.2Kb  71.2Kb  68.3Kb
10.0.0.23              <=> 10.0.0.33       1.60GB  43.7Kb  43.4Kb  41.7Kb
10.0.0.23              <=> 10.0.0.5        1.62GB  28.1Kb  29.6Kb  28.3Kb <----
10.0.0.23              <=> 10.0.0.31        269KB   848b   1.85Kb  1.76Kb
10.0.0.23              <=> 10.0.0.21        269KB   848b   1.34Kb  1.36Kb

 Display paused 19.1Mb           38.1Mb   57.2Mb           76.3Mb     95.4Mb
└───────────────┴────────────────┴───────┴────────────────┴────────────────
10.0.0.33              <=> 10.0.0.2          111MB  58.8Kb  57.6Kb  55.4Kb
10.0.0.33              <=> 10.0.0.23        1.65GB  43.7Kb  43.3Kb  41.9Kb
10.0.0.33              <=> 10.0.0.21        32.1MB  15.6Kb  16.8Kb  16.5Kb <---- ??
10.0.0.33              <=> 10.0.0.31         273KB   848b   1.98Kb  1.89Kb
10.0.0.33              <=> 10.0.0.5          274KB   848b   1.78Kb  1.73Kb


Wan distributed cluster
Display paused 19.1Mb       38.1Mb   57.2Mb            76.3Mb           95.4Mb
└───────────────┴───────────┴─────────┴────────────────┴──────────────────────
10.0.0.5              <=> 10.0.0.31            1.71GB  30.2Kb  31.3Kb  31.0Kb
10.0.0.5              <=> 10.0.0.21            1.71GB  28.1Kb  30.4Kb  30.4Kb
10.0.0.5              <=> 10.0.0.2             1.61GB  15.1Kb  16.3Kb  16.6Kb <----
10.0.0.5              <=> 10.0.0.33             682KB  1.19Kb  1.91Kb  1.77Kb
10.0.0.5              <=> 10.0.0.23            8.83MB  3.91Kb  1.77Kb  1.87Kb <---- ??
10.0.0.5              <=> 10.0.0.153           5.05KB     0b      0b    572b
10.0.0.5              <=> 10.0.0.151           5.91KB     0b      0b    535b

 Display paused 19.1Mb       38.1Mb   57.2Mb            76.3Mb           95.4Mb
└───────────────┴────────────┴────────┴─────────────────┴──────────────────────
10.0.0.21             <=> 10.0.0.31              194MB  28.7Kb  31.2Kb  31.3Kb
10.0.0.21             <=> 10.0.0.5              1.76GB  28.5Kb  30.6Kb  30.4Kb
10.0.0.21             <=> 10.0.0.23             73.8MB  15.6Kb  17.1Kb  17.1Kb <---- ??
10.0.0.21             <=> 10.0.0.33              298KB  1.86Kb  2.00Kb  1.91Kb
10.0.0.21             <=> 10.0.0.2              5.83MB  2.06Kb  1.53Kb  1.42Kb <---- ??
10.0.0.21             <=> 10.0.0.12              351KB  1.53Kb  1.34Kb  1.41Kb


 Display paused 19.1Mb       38.1Mb   57.2Mb            76.3Mb           95.4Mb
└───────────────┴────────────┴────────┴─────────────────┴──────────────────────
10.0.0.31             <=> 10.0.0.5              1.76GB  28.7Kb  31.3Kb  31.1Kb
10.0.0.31             <=> 10.0.0.21              192MB  28.7Kb  31.2Kb  31.3Kb
10.0.0.31             <=> 10.0.0.33             53.3MB  17.8Kb  17.9Kb  17.7Kb <---- ??
10.0.0.31             <=> 10.0.0.23             1.23MB  3.93Kb  2.01Kb  2.31Kb
10.0.0.31             <=> 10.0.0.2               323KB   528b   1.77Kb  1.81Kb
10.0.0.31             <=> 10.0.0.13              354KB  1.28Kb  1.32Kb  1.38Kb


 Display paused 19.1Mb      38.1Mb    57.2Mb           76.3Mb           95.4Mb
└───────────────┴───────────┴─────────┴────────────────┴──────────────────────
10.0.0.2              <=> 10.0.0.23            1.65GB  28.5Kb  30.9Kb  31.2Kb
10.0.0.2              <=> 10.0.0.33            1.65GB  27.7Kb  30.5Kb  31.0Kb
10.0.0.2              <=> 10.0.0.5             1.64GB  15.1Kb  16.3Kb  16.6Kb <----
10.0.0.2              <=> 10.0.0.31             323KB   528b   1.77Kb  1.81Kb
10.0.0.2              <=> 10.0.0.21            5.88MB  2.06Kb  1.53Kb  1.46Kb <---- ??

 Display paused 19.1Mb       38.1Mb   57.2Mb            76.3Mb           95.4Mb
└───────────────┴────────────┴────────┴─────────────────┴──────────────────────
10.0.0.23             <=> 10.0.0.33              118MB  29.8Kb  31.5Kb  31.5Kb
10.0.0.23             <=> 10.0.0.2              1.70GB  29.5Kb  30.8Kb  31.2Kb
10.0.0.23             <=> 10.0.0.21             74.0MB  15.4Kb  16.9Kb  17.0Kb <----??
10.0.0.23             <=> 10.0.0.31             1.22MB  3.31Kb  1.85Kb  2.27Kb
10.0.0.23             <=> 10.0.0.5              8.96MB  3.40Kb  1.67Kb  1.84Kb <---- ??
10.0.0.23             <=> 10.0.0.12              359KB  1.47Kb  1.47Kb  1.36Kb

 Display paused 19.1Mb       38.1Mb   57.2Mb            76.3Mb           95.4Mb
└───────────────┴────────────┴────────┴─────────────────┴──────────────────────
10.0.0.33             <=> 10.0.0.23              118MB  28.1Kb  31.5Kb  31.4Kb
10.0.0.33             <=> 10.0.0.2              1.70GB  27.5Kb  30.2Kb  30.7Kb
10.0.0.33             <=> 10.0.0.31             53.3MB  17.8Kb  17.9Kb  17.7Kb <----??
10.0.0.33             <=> 10.0.0.21              298KB  1.86Kb  2.00Kb  1.91Kb
10.0.0.33             <=> 10.0.0.5               686KB  1.03Kb  1.96Kb  1.78Kb
10.0.0.33             <=> 10.0.0.13              370KB  1.41Kb  1.44Kb  1.42Kb
Apparently all was working fine, and if you notice the nodes 5 -23 and 5-2 seems to work as bridge between the segments.
But if you look carefully (I had point the cases with <---- ??), you will see that there is additional traffic going on, for instance in the first set we have nodes 33-21 exchanging data for 32Mb, and in the second set (wan) even more we have node 23-21 exchanging 73Mb.
It seems nothing, but instead it means there is an exchange of some type. What kind of traffic is going on between SOME nodes? I said SOME on purpose, because other nodes are not generating this that I consider an anomaly.
May be this is by design, if so I would like to know, and would like to know why.
Anyhow a side from this, most of the exchange is actually floating as expected.
More inside the replication
As mention before, the whole exercise was to identify if and if yes which is best settings to use for the cluster working in geographically distributed environment. In relation to that the tests that are more relevant are the number 6 and 8:
6) simple insert on 1 node for on DR only one app on production 2 BUT with WAN connection
8) simple insert on 1 node on DR only one app on production 2 BUT with WAN connection AND GALERA PACK larger
Comparing the differences existing between the gcache.keep_pages_size and page_size settings as well.
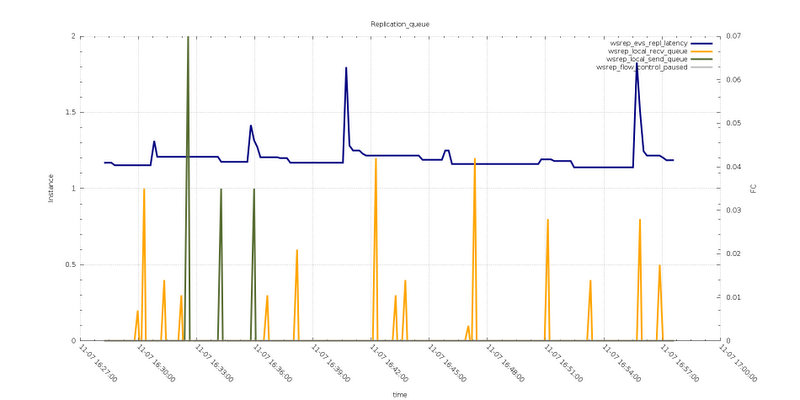
Test6
Test8
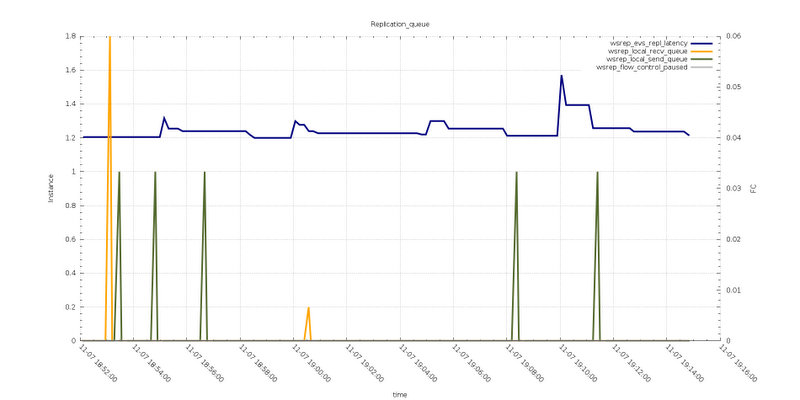
Reviewing the two graphs above, related to the Replication queue, we can see that both tests do not report Flow Control action.
In the case of Test6 the receiving and sending queue had some spikes, that were not present in Test8, meaning the two queues were processed more efficiently when the max_packet_size is larger.
To note is that the wsrep_evs_repl_latency in Test8 is higher, as such the messages seems takes longer to be dispatched, but at the end the performance are better.
Test6
Test8
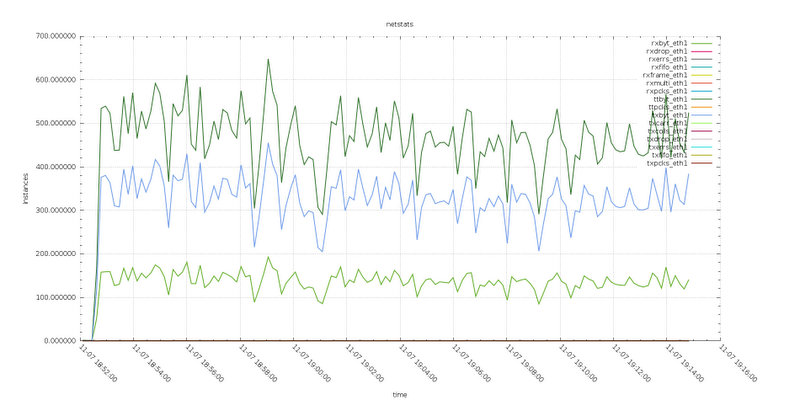
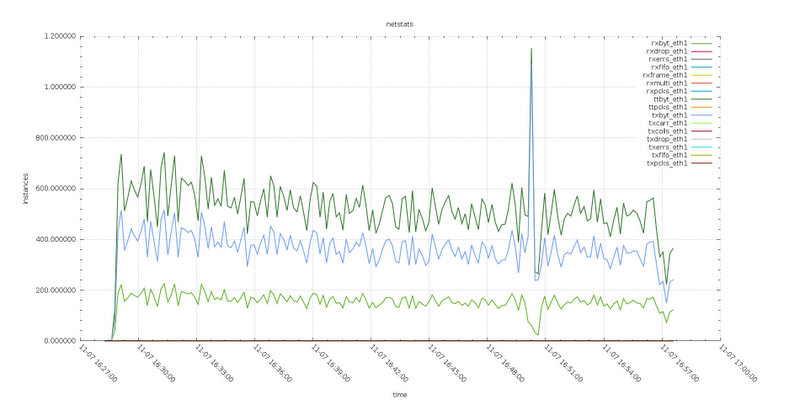
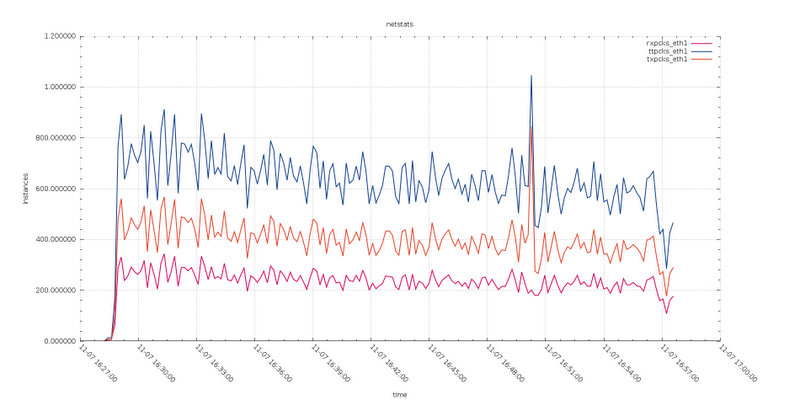
Reviewing the graphs related to Writeset dimension and the Netstat, we can notice that the size of the writesets are larger in the test with default max_packet_size, also network traffic results to be higher. I was surprise about that and I had repeat the tests even more times. At the end magnifying the information related to the transmitted packet, we can notice that when using larger max_packet_size, the distance between received and transmitted is less.
Test6
Test8
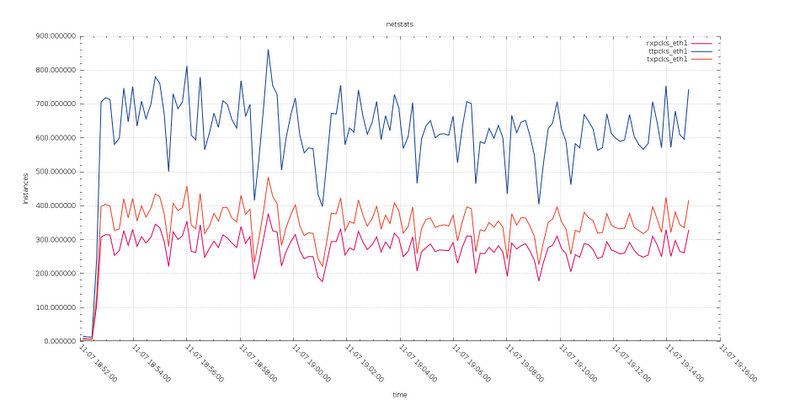
Given in this test we have writes going on two nodes, my conclusion is that the network layer was able to optimize the data transmission, reducing the number of vectors (frames) and as such reducing the overhead.
Test6
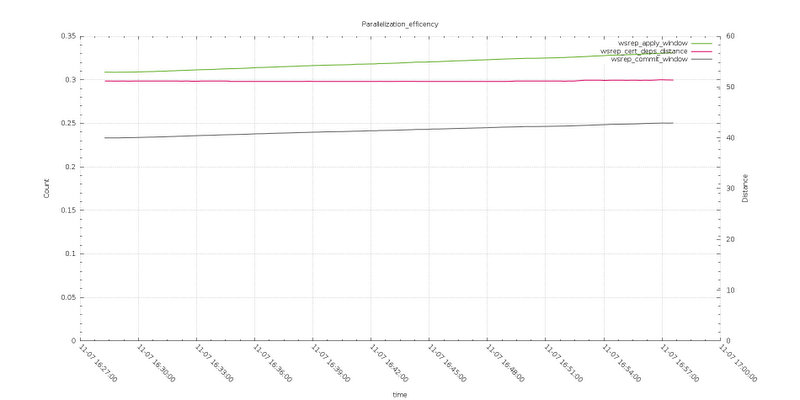
Test8
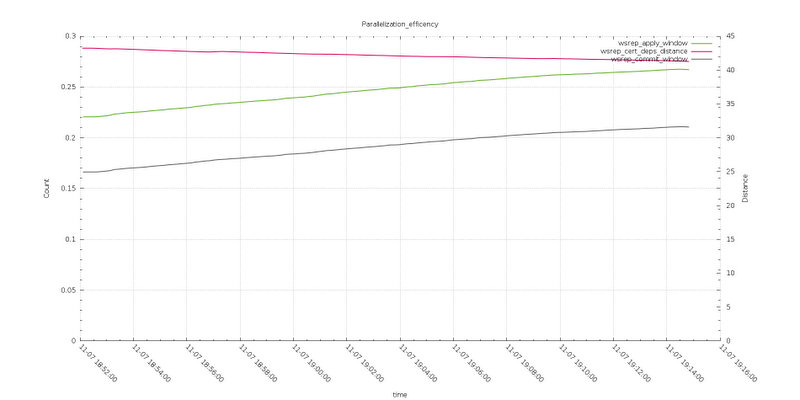
To complete the review related to the galera replication, let take a look to the parallelization efficiency graphs.
Here the differences are more evident. The apply window (Average distance between highest and lowest concurrently applied seqno) when using default max_packet_size is definitely higher, as well the wsrep_commit_window (Average distance between highest and lowest concurrently committed seqno).
Also the wsrep_cert_deps_distance (Average distance between highest and lowest seqno value that can be possibly applied in parallel, potential degree of parallelization), in the first case is steady while with larger max_packet_size it is going down.
I was oriented to read this as an optimize way to apply and commit the incoming data.
Test6
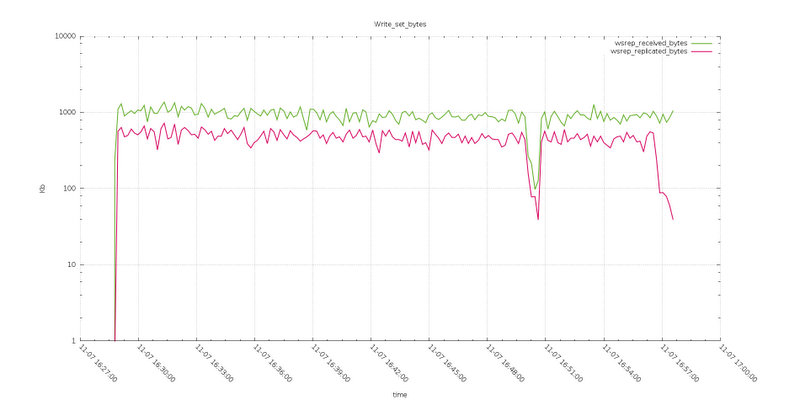
Test8
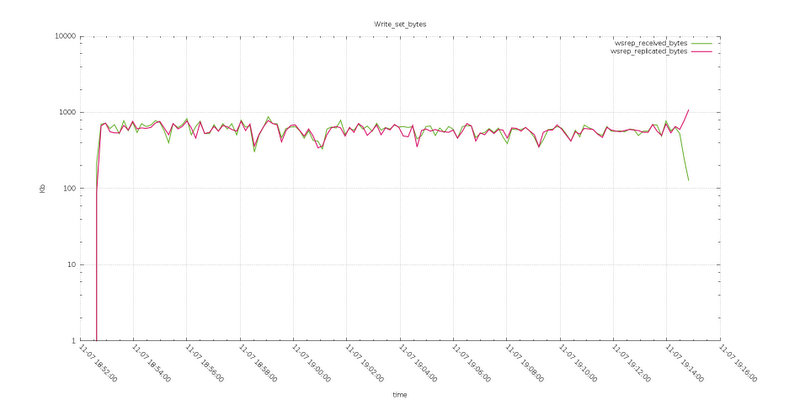
Reviewing the Writeset_byte graphs we can note that while the bytes replicated remain very close between Test6 and Test8, the received are quite larger in the case of smaller/default max_packet_size.
So the node was by the fact receiving less data in Test8, keeping constant the same amount of data from application.
Test6
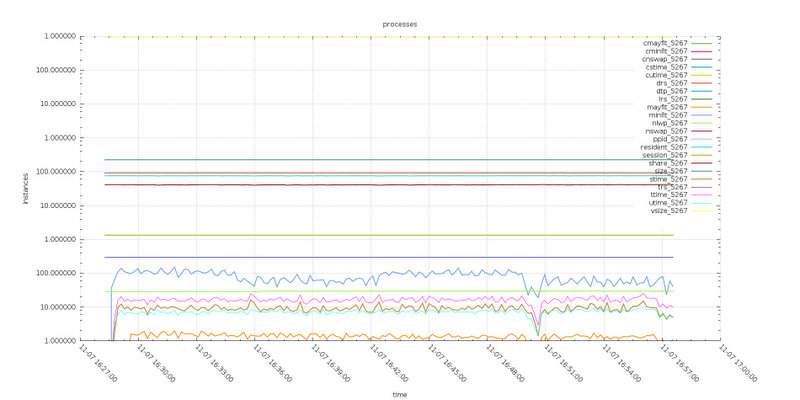
Test8
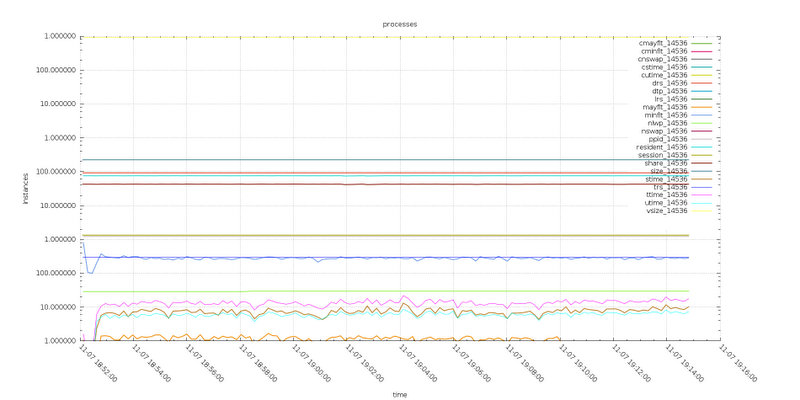
Analyzing the process information the Test6 (default max_packet_size) has more major page fault then Test8, and both system time and user time are larger in Test6. The meaning of this is more I/Operations
The differences are not huge, but they are consistent through the different number of tests.
Conclusions?
I had collect and still collecting a lot of additional data, but for the scope of this article focus on the network and replication side, I prefer to stop.
There is not A conclusion about the whole MySQL/Galera setup, but let me say that I am strongly suggesting to do not use a monolithic setup for all cases.
Instead adapt the configuration following the architecture you are implementing.
So far and from the tests I have done, I can say that:
Cluster implemented in a single site with very good connectivity and using MySQL/Galera for HA or ad write distribute platform:
- Use multiple gcache.keep_pages_size (I had relate the number to the number of cores but I don't see any benefit to go above 8 instance at the moment)
- Use gcache.page_size never less then 32Mb no more 256Mb total
- Use small gcs.max_packet_size 32K
Cluster implemented in a single site with geographic distributed site and using MySQL/Galera on second site for HA only:
- Use single or two gcache.keep_pages_size
- Use default gcache.page_size or little bit larger like 256M
- Use larger gcs.max_packet_size 2097152K
In the final tests I have being using the two following configurations, and they had work great also with significant load, not only for the tests but also when we had implement them at the customer site, using the same load and operation that was crashing the system with Galera 2.x or with other Galera 3.x configurations.
Configuration used for local cluster:
wsrep_provider_options = "gmcast.segment=1|2;socket.ssl_compression=no;gcache.keep_pages_size=2;gcache.page_size=125M;
gcache.size=5024M;evs.send_window=512;evs.user_send_window=512; evs.use_aggregate = true; gcs.fc_factor = 1;
gcs.fc_limit = 32; gcs.max_packet_size = 32768;gcs.fc_debug = 0; evs.inactive_check_period = PT1S;
evs.inactive_timeout = PT15S;evs.suspect_timeout = PT5S; evs.stats_report_period = PT1M;"
Configuration used for geographically distributed DR:
wsrep_provider_options = "gmcast.segment=1|2;socket.ssl_compression=no;gcache.keep_pages_size=4;gcache.page_size=64M;
gcache.size=5024M;evs.send_window=1024;evs.user_send_window=1024; evs.use_aggregate = true; gcs.fc_factor = 1;
gcs.fc_limit = 260; gcs.max_packet_size = 2097152;gcs.fc_debug = 0; evs.inactive_check_period = PT30S;
evs.inactive_timeout = PT1M;evs.suspect_timeout = PT1M; evs.stats_report_period = PT3M;"
Please let me know if in you will experience different results, and how/why.
Great MySQL .... & Galera to all.